# CloudWatch RUM for all insights

[CloudWatch RUM](https://docs.aws.amazon.com/AmazonCloudWatch/latest/monitoring/CloudWatch-RUM.html) was recently launched during re:Invent 2021 which provides insights to your web-application about certain metrics based on user-actions and errors for debugging.
You can read about the [announcement](https://aws.amazon.com/about-aws/whats-new/2021/11/amazon-cloudwatch-rum-applications-client-side-performance/).
{%twitter 1465384891869138946 %}

### Key takeways from the blog 
+ [Understanding CloudWatch RUM ](#understanding-rum)
+ [Setting-up RUM](#setting-up-rum)
+ [Different telemetry data](#data)

### Understanding CloudWatch RUM <a name="understanding-rum"></a>
**CloudWatch Real-User Monitoring (RUM)** is a monitoring functionality facilitated by CloudWatch which has always been the monitoring tool on AWS. RUM enables developers and DevOps engineers to understand the issues/errors encountered on the web-app and also insights such as which *device* or *browser* or *location* had the error. Additionally, there is performance insights and the time taken for a file to load on the client side along with the geographically information. 
As [Jeff Barr](https://twitter.com/jeffbarr) quotes it, it's that simple to implement on the client side.
> You simply register your application, add a snippet of JavaScript to the header of each page, and deploy.

The **CloudWatch RUM** consolidated and provides dashboard which gives you a detailed insights such as - *page load speed*, *geographic info*, *devices*, *browsers*, *average load during the time*, *user journey*. All this with just a snippet of JS to page.

### Setting-up RUM <a name="setting-up-rum"></a>
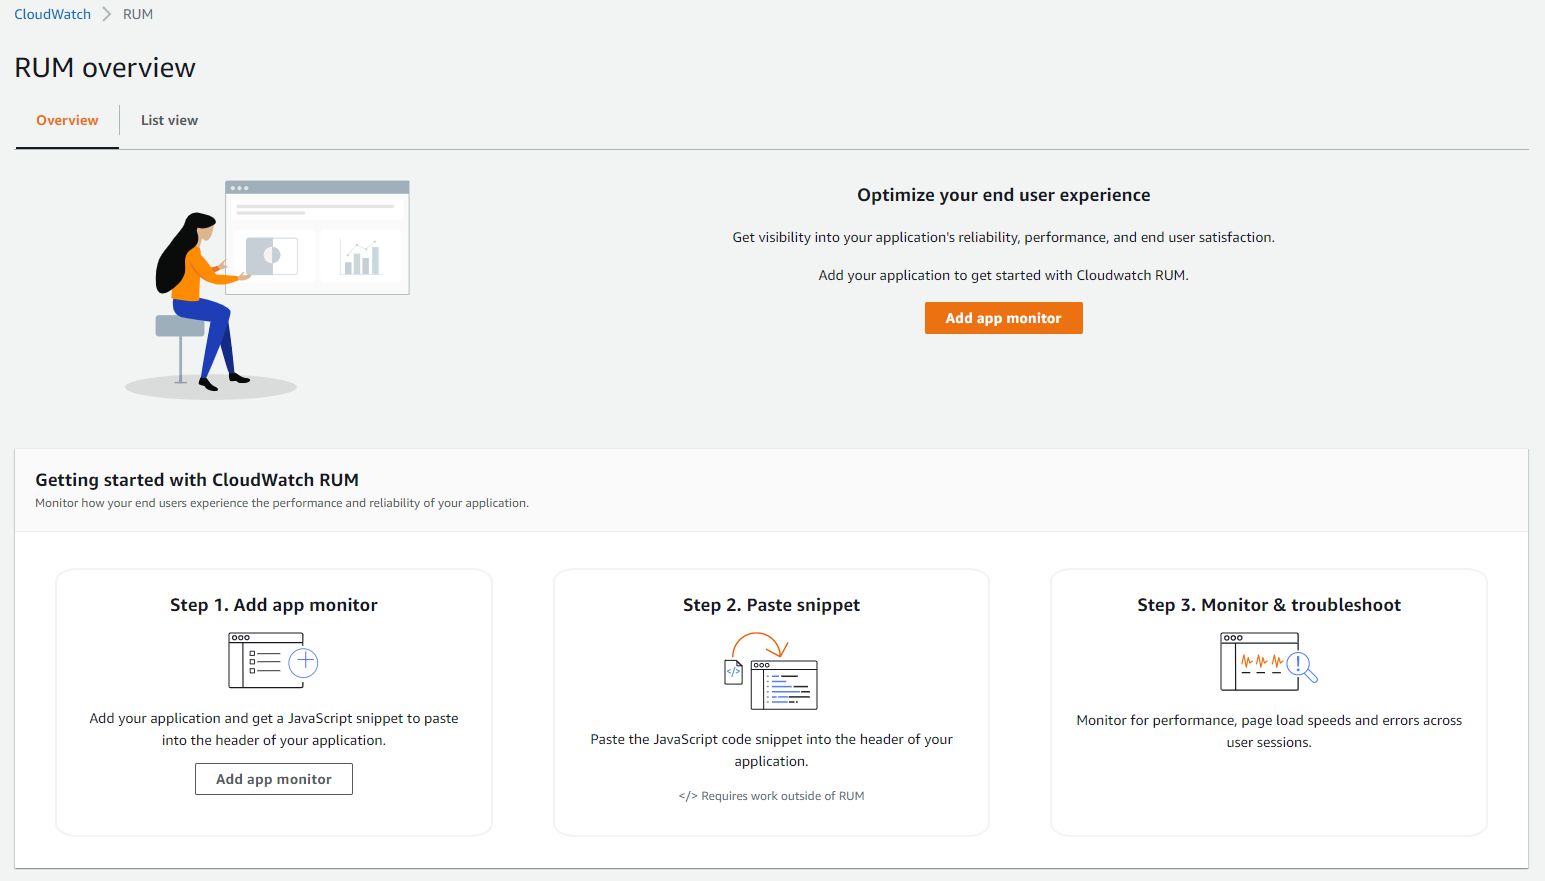
**CloudWatch Real-User Monitoring (RUM)** setup can be summarized with the 3 steps - 
+ [Add app monitor](#add-app)
+ [Adding the JS snippet to your web app](#snippet)
+ [Monitor the web-app from CloudWatch console](#monitoring)
![Setting-up RUM](https://cdn.hashnode.com/res/hashnode/image/upload/v1652432706782/PKfJGH8yT.png)

#### Add app monitor <a name="add-app"></a>
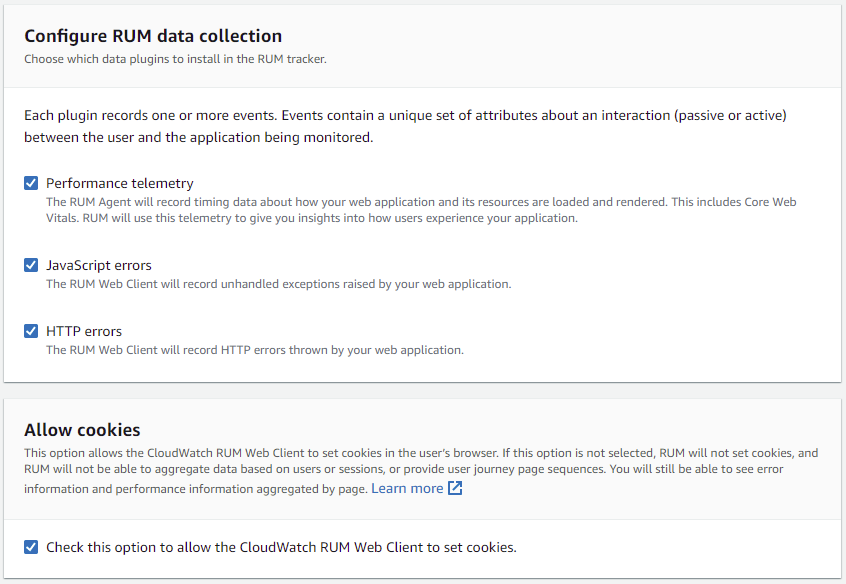
While adding a new app monitor, you would have to specify details such as - *app monitor name*, *app domain* and an option to include the sub-domains of the *app domain*. 
You can choose what all data is been collected and stored as telemetry data for the dashboards.
![Configs](https://cdn.hashnode.com/res/hashnode/image/upload/v1652432708452/nBWtIeAAk.png)
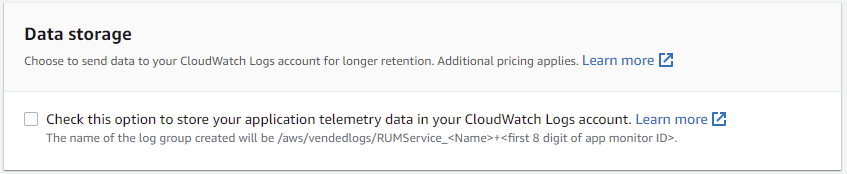
The telemetry data is stored only for *30 days*, so if you would wish to store the logs, you can create a CloudWatch log event which captures and stores all these datas.
![Data storage](https://cdn.hashnode.com/res/hashnode/image/upload/v1652432710099/T-IdsS5FD.png)
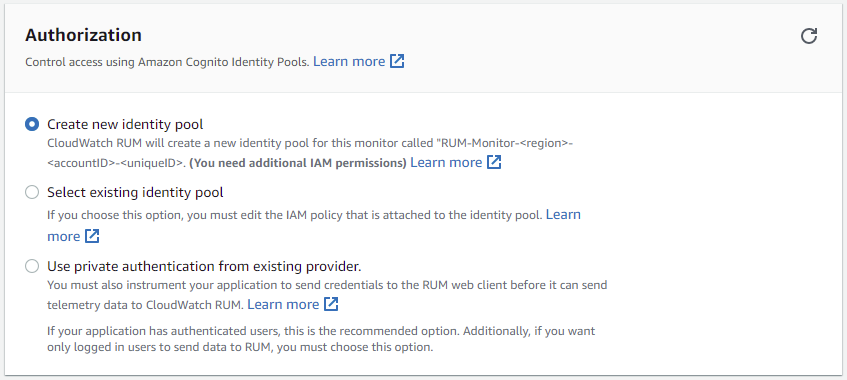
CloudWatch RUM needs authorization to access AWS resources, for which Amazon Cognito Identity Pools are used.
![Authorization](https://cdn.hashnode.com/res/hashnode/image/upload/v1652432711601/JL5zR6SzX.png)
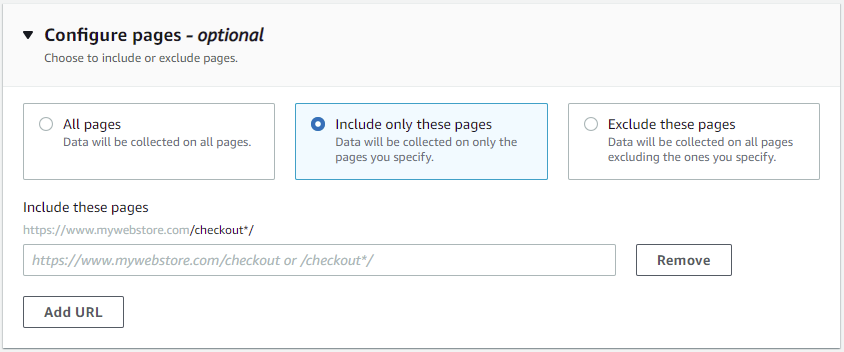
The telemetry data of the web-pages can also be fine grained to the choice of *all pages*, *specific pages only* or *exclude certain pages*.
![Configure pages](https://cdn.hashnode.com/res/hashnode/image/upload/v1652432713116/vAqz5UyGQn.png)

#### Adding the JS snippet to your web app <a name="snippet"></a>
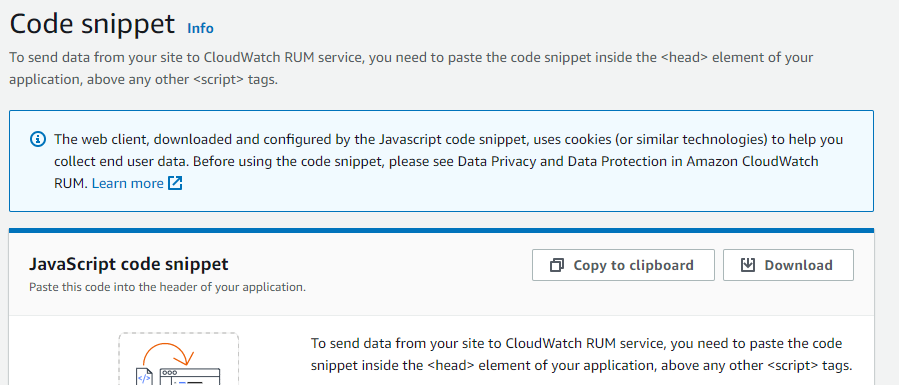
Once you save the configurations and add the app monitor, you would be presented with a JavaScript snippet. 
![JS snippet](https://cdn.hashnode.com/res/hashnode/image/upload/v1652432714873/kpjC5f1NoI.png)
As simple as it is, this just needs to be added to the `<head>` of your web-page which is sending telemetry data using the `<script>` tag. 
 
#### Monitor the web-app from CloudWatch console <a name="monitoring"></a>
Once set-up and moved your web-page to the server, you can navigate to your CloudWatch console to view the dashboard. 
![Overview dashboard](https://cdn.hashnode.com/res/hashnode/image/upload/v1652432716519/nukuBR2tY.png)

### Different telemetry data <a name="data"></a>
From your CloudWatch console, you can view different types of insights. The previous section shows the overview of your app monitor.

Page load speed data for 1 month (Dec 17th 2021 - Jan 16th 2022)
![Page load speed](https://cdn.hashnode.com/res/hashnode/image/upload/v1652432718186/QVNDFqBga.png)
Different web vitals for 1 month (Dec 17th 2021 - Jan 16th 2022)
![Different web vitals](https://cdn.hashnode.com/res/hashnode/image/upload/v1652432719787/NnqVaARFB.png)
Different web browsers used for 1 month (Dec 17th 2021 - Jan 16th 2022)
![Different web browsers](https://cdn.hashnode.com/res/hashnode/image/upload/v1652432721530/UBzSUsdgz.png)
Different devices used for 1 month (Dec 17th 2021 - Jan 16th 2022)
![Different devices](https://cdn.hashnode.com/res/hashnode/image/upload/v1652432723061/yC20M_qOu.png)
Different locations with page load time for 1 month (Dec 17th 2021 - Jan 16th 2022)
![Different locations with page load time](https://cdn.hashnode.com/res/hashnode/image/upload/v1652432725004/mst196gbB.png)
<!--![all positive](https://cdn.hashnode.com/res/hashnode/image/upload/v1652432726825/FdfF7P7uW.png)-->
Different locations with sessions for 1 month (Dec 17th 2021 - Jan 16th 2022)
![Different locations with sessions](https://cdn.hashnode.com/res/hashnode/image/upload/v1652432728599/ZcxCQyvBk.png)
You can view the details at a country filter of sessions for 1 month (Dec 17th 2021 - Jan 16th 2022)
![Country filter](https://cdn.hashnode.com/res/hashnode/image/upload/v1652432730464/zx5tKvo4a.png)
For multiple pages, you can even get the user-journey.
![User-journey](https://cdn.hashnode.com/res/hashnode/image/upload/v1652432731958/UPknb1tcN.png)
For the sessions with errors, you can view what the error was and also the data time of occurrence along with device details. 
![Error session](https://cdn.hashnode.com/res/hashnode/image/upload/v1652432733372/8wsJAeG14.png) 
![Error sessions details](https://cdn.hashnode.com/res/hashnode/image/upload/v1652432734886/wndiXAFnd.png)

### Pricing
The free trial has 1 million RUM events which is across the account. And this is only for the first time when RUM is used. Post which, $1 per 100k RUM events.
You can view the detailed [pricing details](https://aws.amazon.com/cloudwatch/pricing/).

### Wrap-up
**CloudWatch RUM** has provided a simplistic approach to web-app insights. The above sample logs and telemetry data are of my personal landing page https://zachjonesnoel.com which has been up and running from Dec 01 2021 and this dashboard has facilitated me to understand what and how is the performance.
Jeff Barr writes about the [New – Real-User Monitoring for Amazon CloudWatch](https://aws.amazon.com/blogs/aws/cloudwatch-rum/).

